 Goals are often used to provide motivation, and that is one of their important functions. When we speak of goals we generally don’t mention an important part of their structure, the baseline. Without a baseline, you can’t know if the change you are experiencing is in the right direction to get you where you want to go. When we talk about goals, we have to talk about baselines. Every goal has its baseline. Without a baseline, a goal is just another statement floating aimlessly on a sea of good intentions.
Our performance is connected to our goal, but was that performance real. Will my performance today reappear tomorrow? Will my performance this week occur again next week? For a performance to be real, it must have some permanence. To evaluate my performance, I need to know how permanent it is. If my performance has sustained itself over three consecutive days, then I have some basis for predicting that it will continue for another 3 days.
Confidence in predicting is one important function of a baseline. But baselines tell us more about our performance than their likely permanence. For example, it tells us how much our performance varies, how stable it is over time. In addition to the variance and predictability of our performance, the baseline also provides us with a measure against which we can evaluate our future performance. It is this last factor that this blog will discuss.
Baseline for Goals
I’ve started training for a marathon. There are a few questions I need to answer before I get too far into my training. First, can I actually run 26.2 miles? If I can’t, can I learn to run 26.2 miles? Basically, I need to know how far I can run, now, and my rate of progress in training. I want to run a marathon within 10 years. So, I look into my soul and find that I absolutely know I can do this. I’ve watched marathons on YouTube. I love long distance running. I am excited about just the experience of running 26.2 miles!! I have set difficult goals in my life and have met them. I can do this!!! There is no doubt in my mind!!!
One thing the marathon runner needs is emotional control and motivation!! There will be days of grueling work. Can I do that? Yes!! Yes!! Yes!! Or so I think. I have the motivation; however, I need more assurance that I can do it. I’m basing my enthusiasm on my subjective knowledge of myself. I don’t have any objective knowledge of my ability to run 26.2 miles, because I have never tried it before. In fact, I’ve always considered running 26.2 miles impossible. I have never known how anyone could do that.
Subjective knowledge is important as long as we remember it is subjective. The problem is that people begin to think their subjective knowledge is objective. Objectivity is an important part of the “real.” To know what the situation is outside of our desires, ambitions, hopes, and dreams is powerful knowledge. We can step outside our subjectivity through an important mental function, observation. Everyday, we engage this mental function. We observe our environment thousands of times each day. We must be very good at it!
But our daily observations are more habitual than intentional. For our baseline, we need intentional observations. We need accuracy in our observations; habitual observations can be filled with error. Aspects of our subjective knowledge can seep into our habitual observations and bias them. Rather than the fleeting glance that underlies our daily observations, we need intentioned, systematic attention to specific aspects of our performance. This is the objectivity of our baseline data.
How to Baseline Goals
To set effective baseline goals, one must identify factors that control their achievement. The baseline can help in this. By itself, the baseline is a type of pretest. It tells you what you can do before you have received instruction. At some point, you begin training or instruction on the skill you want to improve. You continue to collect data as you have done during baseline. What is important here is that the data you collect after starting training has been collected under different conditions than those you collected during baseline. You can strictly define the conditions of baseline and the conditions of training or instruction. The conditions of training contain different factors than the conditions of baseline.
For example, suppose my training for running a marathon is running 3 miles 3 times per week with a run of 1 1/2 miles the first 30 minutes of training and 1 1/2 miles the second 30 minutes of training following a 20 minute rest. Thus, for the training, I have 30 minutes to run 1 1/2 miles. then I rest 20 minutes, and I have 30 more minutes to run another 1 1/2 miles. Before I begin implementing this training, I would need to take data for several days where I ran as far as I can before I need a rest. So, on each day before I begin training, I am recording how far I run before needing a rest.
In the graph below showing the baseline data for running 30 minutes on three consecutive days, I ran 1.5 miles, 1.75 miles and 1.4 miles.
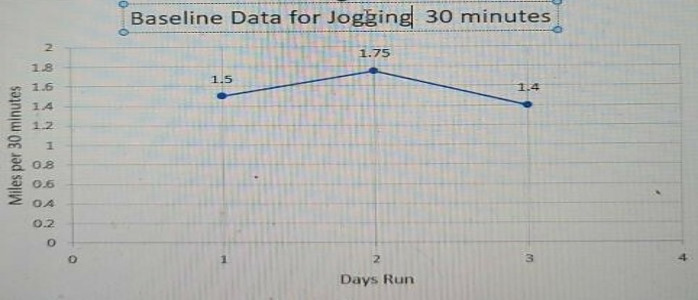
These recordings are my baseline data. The conditions are those of my daily living activities. Thus, the only exercise I get while I am taking the baseline is the exercise I get from my daily living activities.
Now I have two sets of data. Those data taken during my baseline condition and those data taken during my training condition. The training introduces new factors into the conditions, that of running 3 miles per day. I can continue the training conditions for as long as I want. Let’s say I choose to continue the training conditions for 1 month. My training is defined by the distance I run each day for 3 days per week and the number of weeks I implement the running. The data for my training show that I implemented the training 3 days per week for 1 month. Those data could be shown as in the next graph.
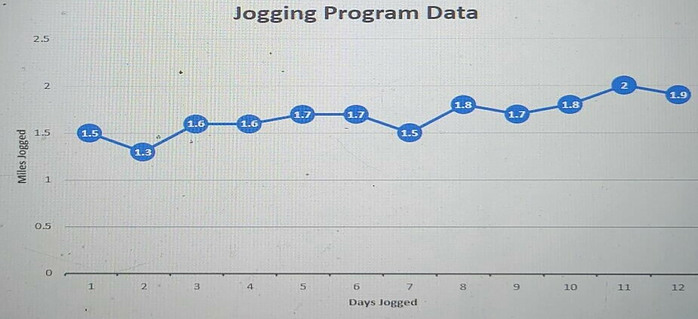
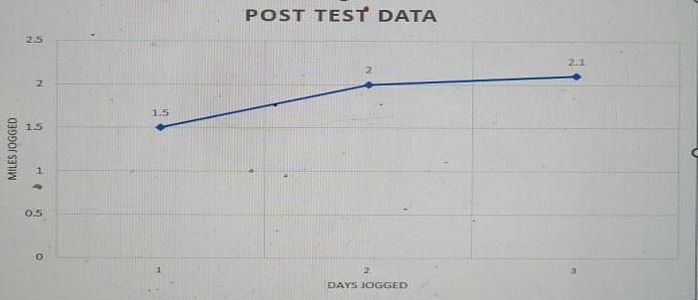
The daily data taken during my training provide important information, but it is the last three data points that interest us now. Those points are not shown in the Jogging Program Data graph. Our baseline consisted of three data points. That is the minimum number of data points you should take. We are treating the baseline like a pretest. Now we need a posttest. So we will reinstate the same conditions as we had in our pretest and record our data. Those conditions were that we would run as far as we could. We will also run on the same terrain as we did in our pretest.
We need one more data set to evaluate the effectiveness of the training. For this new data set, I record my running under the conditions of the first data set for exactly the number of days recorded in the first data set. This first data set is the baseline taken before I implemented the training. The conditions of the first data set were the terrain I ran on and how I ran. I ran as far as I could each day without stopping. I recorded my distance achieved each day as the data.
Importance Baseline Data
As the days go by and I collect data on my business’ performance, now do I evaluate it? Do I just guess what it means? Oh, I like the amount of sales I made this week! This weeks performance is good!! Well, maybe its not so good. Baseline data are like a measuring rod against which we can judge future performance. Looking at the baseline data shown in the graph above, the three data points reveal variation that is trending in a slightly downward path. This trend is visible to the eye. The second graph shows quite a different data set. The data points in both graphs are equal, 1.5 miles, but the other two data points in the second graph show a steady increase in performance.
What if I had not taken baseline data and had done an A.B study. Here I would have taken only the first data points for each graph. The graph of these data points would have shown my training program had produced no progress. Baseline data and at least 3 points for each data set (the data collected before my program was implemented and the data collected after one month of implementation) allow me to see the progress produced by my program. In addition, the three points gives me additional information about my performance. This additional information is called a trend.
A trend is the direction a graph lie takes across time. The trend tells us if the data are decreasing, staying the same, or increasing as time progresses. The data in the baseline data above shows a slightly decreasing trend. If I had taken more data in the baseline, the trend probably would have flattened out and stayed the same. The data in the second graph, those taken after one month of training, show a slight increase in the trend. We say the trend is positive, and this suggests that not only is the training showing an improvement in performance but is increasing performance across time. The trend line allows us to expect a continued increase in performance.
If I had only taken two data points before and after training, we would not have the information provided by the trend line. The first two points in the baseline graph shows a positive trend and it appears to be greater than the trend shown in the second graph. These three data points don’t prove that the training program produced an increase in performance, but they give us some indication of what is happening in the training. They give us information on which we can make more reliable decisions than would be possible with less then three data points.
How to Set Goals for Your Business
But what if I’m not a sports trainer and just want to sell some products as an affiliate marketer? What can I take away here that I can use? First, a single data point tells you nothing. You need to take at least 3 data points in each A/B condition. Secondly, in the example of my training in running, I implemented a training program between my first data collection, condition A, and my second data collection, condition B. As an affiliate marketer your “training program” is the running of your advertisement and the changes you make in those advertisements. For example, lets assume I have been running an ad for iPhones. I have been making some sells but not as many as I would like to make. So I devise another ad for iPhones. I want some information that will help me decide if the second ad sells more iPhones than the first ad.
Running the second ad is the same as implementing the running training in my example. Before I run my second ad, I take three days of sales data on my first ad. This is my baseline against which I will evaluate the performance of my second ad. After I collect the three days of data on my first ad, I then run the new ad for three days. It’s important to not run the two ads at the same time. That will just cloud the data. Now I have two sets of data. One set which is the 3-day performance of my first ad (this is the baseline for the second ad) and the other set is the 3-day performance of my second ad. I then use an Excel program to create a graph of the two data sets.
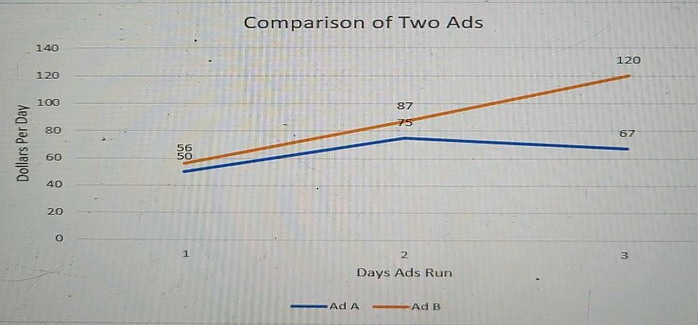
The graph just above shows the baseline and post-test data for the two ads. The baseline data were those taken for Ad A and the post-test data were those taken for Ad B. In the graph, the data for Ad A are shown by the blue line; the data for Ad B are shown by the red line. Because there are only three data points for each line, we can’t be completely confident about the future performance of these ads. If we took more data, would the red line go down while the blue line goes up? Do these graphs give us a good comparison of the performance of the two ads?
Only additional data will tell us for sure, but our confidence of the comparison is strengthened by the slopes of the lines. These are the trajectory of the lines. The red line is positioned in an upward direction. It looks like if we took more data that line would likely continue upward. However, the blue line appears to be positioned in a downward direction. It looks like if we took more data it would continue downward, or at least level out. Thus, the slopes of the lines suggest we should be confident that the graphs show a true comparison of the ads’ performance.
Conclusion
Testing the performance of your ads is time consuming. Unless you have a large research budget, you will be working with small data sets. The A/B comparisons are a useful measurement tool, but you will need at least three data points for each ad. Three data points allow you to draw a conclusion about the comparison. Data with less than three points tell you nothing. You might as well guess. You could run the ads simultaneously, but I suggest you run them consecutively. I feel that the data will be clearer if the context for each ad includes all the people who are seeking to buy your product. If the ads are run simultaneously, then the context will be just some of the people who are seeking to buy your product. The larger the number of people who are looking at your ads, the clearer the data will be, in my opinion. Baselines offer a means of providing an objective evaluation of your data. This objectivity is important for you to make the correct decisions for your business.
This was really interesting to read!
I’ve never been particularly good at sticking to goals, I’d make a bunch and fail to stick to a single one. I think that’s probably due to my perfectionistic tendencies, the goals were always far too unachievable, and there were always far too many.
However, I know that goals are really important for business, as they provide somewhere/something to work towards, and a great measure for evaluating business performance.
I think this concept of determining a “baseline” for your goals, and then creating your goals according to that baseline is an excellent idea, as it ensures that the goals are reasonable and achievable.
This was really great to learn, I will certainly be implementing this into my future business goal-making.
Thanks for sharing!
Ursidae,
Thank you very much for your feedback. It was very helpful. You are right. People often don’t know how to make meaningful goals, because they fail to establish where they are in their performance. Without a baseline, you can’t measure your performance. The best of luck in your business.